


Image Credit: Depositphotos
“What do the three graphs mean?”
This is a question we receive often from our DISC profile clients.
DISC is an assessment of a person’s strengths and weaknesses. It provides a great and very accurate resource for helping people learn best practices for communication with different styles, how to establish an environment where they and their team can do their best work, and what innate skills and abilities they bring to the table to best serve their work and purpose.
But what about the graphs?
There is an area in the report where it shows three graphs. Once a person comes to understand those three graphs, they realize their value as indicators.
The third graph shows who a person is plus the skills and traits they have developed in life.
I like to describe it as “muscle” because the same principle applies. If you practice a strength by exercising at length, it becomes even stronger. Thus, the third graph shows strength at length. People with well-developed strengths have developed high levels of expertise by applying focused work to the areas that are already strong for them. Where a strength may have become over-balanced, the third graph may show a slight re-balancing that helps to under-gird their strengths.
The middle chart shows who a person is at the core.
It is a bit like a baseline for your strengths. Under stress, you will often revert to this baseline because it is “comfortable” and requires little to no exerted effort. Under extended and extreme stress, many will tend to go deeper into their secondary strengths as well. It is a built-in support system for times of weakness.
The second and third graphs show baseline and applied development.
In the example below, graph 2 (middle) and 3 (right) show a person who has managed to stay true to their strengths, with some strengthening of their propensity for creating systems. It also shows that their “C” has lowered somewhat but is still at a healthy level. This likely indicates that they have come to realize that sometimes “good enough” is more productive than perfectionism.
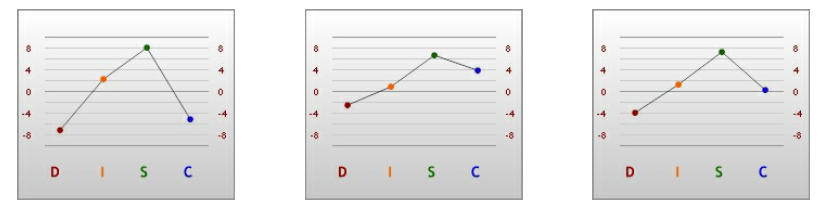
The first chart, however, can show strong deviation, as also seen in this example.
This is a strong indicator that something this person is doing currently does not fit. They are trying to adapt, but it is clear this person is not operating from a zone of strength.
Think about this: If this were your employee, what would you learn from seeing this deviation?
This particular deviation shows that this person is downplaying their ability to lead and lead well. It can indicate they are in a position that does not value their leadership and insights.
And, so, what do they do?
They put on a smile (notice the “I” is higher) and they try harder to “go with the flow,” as indicated by the higher “S.”
As a leader, do you see a happy, productive employee here, who is operating in their zone of strengths?
Or do you see someone who is trying to do a job or work in an environment that does not truly fit them?
What would happen if you adjusted their responsibilities in such a way that they were more in alignment with their true strengths?
- What would be the benefit to the individual?
- And what would be the benefit to the company?
Sadly, this type of deviation is not uncommon in today’s workforce. That means many employees are trying to make the best of a situation that simply does not fit. Even sadder, they may do this for decades, to a point where they may feel like they have “lost themselves.”
As leaders, our most important role is not to get things done.
In the end, our most important contributions are in the growth of our team and how we have served our customers and clients.
Business is all about investing in people, including ourselves.
Look at the DISC report as you look at your stock portfolio.
Both indicate performance based on healthy benchmarks.
Have you invested well?
Do you continue to invest in your people and in yourself?
—
For more resources on DISC assessments and how they can help you grow your people and your business, click here.
As the CEO of Strength Leader Development, Deb Ingino is a highly sought-after international executive mentor, coach, trainer and speaker. Deb is well versed in global business operations and helps business leaders and their teams to discover and leverage their strengths, so they can create highly collaborative teams that deliver great results. With a refreshingly direct style, Deb helps leaders and their teams to deliver profitable results. Connect with Deb to learn more about her mentorship and coaching programs to equip you with advanced strategies to elevate your results.
")


")
+ view comments . . .